Search for Indicators
Infectious Diseases
Indicators related to "Infectious Disease" are listed below.
Use the drop-down menu below to select the location for which you would like to view data.
Scroll to view indicators, which are categorized as relating to health behaviors, the built environment, or health outcomes.
Click on the name of the indicator to view more information, such as how other locations compare to the selected location.
Indicator Gauge Icon Legend
Legend Colors
Red is bad, green is good, blue is not statistically different/neutral.
Compared to Distribution
 the value is in the best half of communities.
 the value is in the 2nd worst quarter of communities.
 the value is in the worst quarter of communities.
Compared to Target
 meets target;
  does not meet target.
Compared to a Single Value
 lower than the comparison value;
 higher than the comparison value;
 not statistically different from comparison value.
Trend

 non-significant change over time;
 significant change over time;
  no change over time.
Compared to Prior Value
 higher than the previous measurement period;
 lower than the previous measurement period;
 no statistically different change from previous measurement period.
County: Shelby
Health / Immunizations & Infectious Diseases
Value
Compared to:
County: Shelby Age-Adjusted Death Rate due to HIV
County: Shelby Age-Adjusted Death Rate due to HIV
4.6
Deaths per 100,000 population
(2018-2020)
Compared to:

TN Value
(1.7)
The regional value is compared to the Tennessee State value.
US Value
(1.4)
The regional value is compared to the national value.
Prior Value
(4.9)
Prior Value compares a measured value with the previously measured value. Confidence intervals were taken into account in determining the direction of the comparison.
Trend
This comparison measures the indicator’s values over multiple time periods.<br>The Mann-Kendall Test for Statistical Significance is used to evaluate the trend<br>over 4 to 10 periods of measure, subject to data availability and comparability.
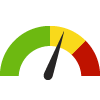
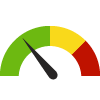
County: Shelby Age-Adjusted Death Rate due to Influenza and Pneumonia
County: Shelby Age-Adjusted Death Rate due to Influenza and Pneumonia
19.5
Deaths per 100,000 population
(2018-2020)
Compared to:

TN Counties
The distribution is based on data from 60 Tennessee counties.
U.S. Counties
The distribution is based on data from 1,449 U.S. counties and county equivalents.
TN Value
(18.5)
The regional value is compared to the Tennessee State value.
US Value
(13.4)
The regional value is compared to the national value.
Prior Value
(18.1)
Prior Value compares a measured value with the previously measured value. Confidence intervals were taken into account in determining the direction of the comparison.
Trend
This comparison measures the indicator’s values over multiple time periods.<br>The Mann-Kendall Test for Statistical Significance is used to evaluate the trend<br>over 4 to 10 periods of measure, subject to data availability and comparability.
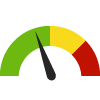
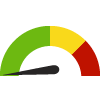
County: Shelby Cervical Cancer Incidence Rate
County: Shelby Cervical Cancer Incidence Rate
8.6
Cases per 100,000 females
(2016-2020)
Compared to:
U.S. Counties
The distribution is based on data from 696 U.S. counties and county equivalents.
TN Value
(7.8)
The regional value is compared to the Tennessee State value.
US Value
(7.5)
The regional value is compared to the national value.
Prior Value
(9.1)
Prior Value compares a measured value with the previously measured value. Confidence intervals were taken into account in determining the direction of the comparison.
Trend
This comparison measures the indicator’s values over multiple time periods.<br>The Mann-Kendall Test for Statistical Significance is used to evaluate the trend<br>over 4 to 10 periods of measure, subject to data availability and comparability.
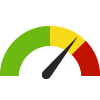
County: Shelby Chlamydia Incidence Rate
County: Shelby Chlamydia Incidence Rate
1,071.1
Cases per 100,000 population
(2021)
Compared to:


TN Counties
The distribution is based on data from 95 Tennessee counties.
U.S. Counties
The distribution is based on data from 2,800 U.S. counties and county equivalents.
TN Value
(562.4)
The regional value is compared to the Tennessee State value.
US Value
(495.5)
The regional value is compared to the national value.
Prior Value
(978.3)
Prior Value compares a measured value with the previously measured value. Confidence intervals were not taken into account in determining the direction of the comparison.
Trend
This comparison measures the indicator’s values over multiple time periods.<br>The Mann-Kendall Test for Statistical Significance is used to evaluate the trend<br>over 4 to 10 periods of measure, subject to data availability and comparability.
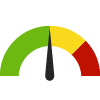
County: Shelby COVID-19 Daily Average Case-Fatality Rate
County: Shelby COVID-19 Daily Average Case-Fatality Rate
0.2
Deaths per 100 cases
(Mar 3, 2023)
Compared to:
TN Counties
(Jan 13, 2023)
The distribution is based on data from 95 Tennessee counties.
U.S. Counties
(Mar 25, 2022)
The distribution is based on data from 2,811 U.S. counties and county equivalents.
TN Value
(1.2)
The regional value is compared to the Tennessee State value.
US Value
(1.7)
The regional value is compared to the national value.
Prior Value
(1.0)
Prior Value compares a measured value with the previously measured value. Confidence intervals were not taken into account in determining the direction of the comparison.
Trend
This comparison measures the indicator’s values over multiple time periods.<br>The Mann-Kendall Test for Statistical Significance is used to evaluate the trend<br>over 4 to 10 periods of measure, subject to data availability and comparability.
County: Shelby COVID-19 Daily Average Incidence Rate
County: Shelby COVID-19 Daily Average Incidence Rate
6.38
Cases per 100,000 population
(Mar 3, 2023)
Compared to:
TN Counties
The distribution is based on data from 95 Tennessee counties.
U.S. Counties
The distribution is based on data from 3,142 U.S. counties and county equivalents.
TN Value
(11.69)
The regional value is compared to the Tennessee State value.
US Value
(10.97)
The regional value is compared to the national value.
Prior Value
(7.39)
Prior Value compares a measured value with the previously measured value. Confidence intervals were not taken into account in determining the direction of the comparison.
Trend
This comparison measures the indicator’s values over multiple time periods.<br>The Mann-Kendall Test for Statistical Significance is used to evaluate the trend<br>over 4 to 10 periods of measure, subject to data availability and comparability.
County: Shelby Flu Vaccinations: Medicare Population
County: Shelby Flu Vaccinations: Medicare Population
53.0%
(2022)
Compared to:
TN Counties
The distribution is based on data from 95 Tennessee counties.
U.S. Counties
The distribution is based on data from 3,129 U.S. counties and county equivalents.
TN Value
(51.0%)
The regional value is compared to the Tennessee State value.
US Value
(50.0%)
The regional value is compared to the national value.
Prior Value
(49.0%)
Prior Value compares a measured value with the previously measured value. Confidence intervals were not taken into account in determining the direction of the comparison.
Trend
This comparison measures the indicator’s values over multiple time periods.<br>The Mann-Kendall Test for Statistical Significance is used to evaluate the trend<br>over 4 to 10 periods of measure, subject to data availability and comparability.
County: Shelby Gonorrhea Incidence Rate
County: Shelby Gonorrhea Incidence Rate
561.6
Cases per 100,000 population
(2021)
Compared to:
TN Counties
The distribution is based on data from 95 Tennessee counties.
U.S. Counties
The distribution is based on data from 3,117 U.S. counties and county equivalents.
TN Value
(269.1)
The regional value is compared to the Tennessee State value.
US Value
(214.0)
The regional value is compared to the national value.
Prior Value
(483.5)
Prior Value compares a measured value with the previously measured value. Confidence intervals were not taken into account in determining the direction of the comparison.
Trend
This comparison measures the indicator’s values over multiple time periods.<br>The Mann-Kendall Test for Statistical Significance is used to evaluate the trend<br>over 4 to 10 periods of measure, subject to data availability and comparability.
County: Shelby Overcrowded Households
County: Shelby Overcrowded Households
2.0%
(2018-2022)
Compared to:
TN Counties
The distribution is based on data from 95 Tennessee counties.
TN Value
(1.9%)
The regional value is compared to the Tennessee State value.
US Value
(3.4%)
The regional value is compared to the national value.
Trend
This comparison measures the indicator’s values over multiple time periods.<br>The Mann-Kendall Test for Statistical Significance is used to evaluate the trend<br>over 4 to 10 periods of measure, subject to data availability and comparability.
County: Shelby Persons Fully Vaccinated Against COVID-19
County: Shelby Persons Fully Vaccinated Against COVID-19
58.1%
(May 10, 2023)
Compared to:
TN Counties
The distribution is based on data from 95 Tennessee counties.
U.S. Counties
The distribution is based on data from 3,125 U.S. counties and county equivalents.
Prior Value
(58.1%)
Prior Value compares a measured value with the previously measured value. Confidence intervals were not taken into account in determining the direction of the comparison.
Trend
This comparison measures the indicator’s values over multiple time periods.<br>The Mann-Kendall Test for Statistical Significance is used to evaluate the trend<br>over 4 to 10 periods of measure, subject to data availability and comparability.
County: Shelby Pneumonia Vaccinations: Medicare Population
County: Shelby Pneumonia Vaccinations: Medicare Population
8.0%
(2022)
Compared to:


TN Counties
The distribution is based on data from 95 Tennessee counties.
U.S. Counties
The distribution is based on data from 3,129 U.S. counties and county equivalents.
TN Value
(8.0%)
The regional value is compared to the Tennessee State value.
US Value
(8.0%)
The regional value is compared to the national value.
Prior Value
(6.0%)
Prior Value compares a measured value with the previously measured value. Confidence intervals were not taken into account in determining the direction of the comparison.
Trend
This comparison measures the indicator’s values over multiple time periods.<br>The Mann-Kendall Test for Statistical Significance is used to evaluate the trend<br>over 4 to 10 periods of measure, subject to data availability and comparability.
County: Shelby Salmonella Infection Incidence Rate
County: Shelby Salmonella Infection Incidence Rate
17.7
Cases per 100,000 population
(2018)
Compared to:
TN Value
(16.7)
The regional value is compared to the Tennessee State value.
Prior Value
(16.3)
Prior Value compares a measured value with the previously measured value. Confidence intervals were not taken into account in determining the direction of the comparison.
HP 2030 Target
(11.5)
County: Shelby Syphilis Incidence Rate
County: Shelby Syphilis Incidence Rate
32.8
Cases per 100,000 population
(2021)
Compared to:
TN Counties
The distribution is based on data from 95 Tennessee counties.
TN Value
(13.6)
The regional value is compared to the Tennessee State value.
US Value
(16.2)
The regional value is compared to the national value.
Prior Value
(26.9)
Prior Value compares a measured value with the previously measured value. Confidence intervals were not taken into account in determining the direction of the comparison.
Trend
This comparison measures the indicator’s values over multiple time periods.<br>The Mann-Kendall Test for Statistical Significance is used to evaluate the trend<br>over 4 to 10 periods of measure, subject to data availability and comparability.
County: Shelby Syphilis Incidence Rate
County: Shelby Syphilis Incidence Rate
40.8
Cases per 100,000 population
(2021)
Compared to:
TN Counties
The distribution is based on data from 95 Tennessee counties.
TN Value
(12.0)
The regional value is compared to the Tennessee State value.
US Value
(13.1 in 2020)
The regional value is compared to the national value.
Prior Value
(36.1)
Prior Value compares a measured value with the previously measured value. Confidence intervals were not taken into account in determining the direction of the comparison.
Trend
This comparison measures the indicator’s values over multiple time periods.<br>The Mann-Kendall Test for Statistical Significance is used to evaluate the trend<br>over 4 to 10 periods of measure, subject to data availability and comparability.
County: Shelby Tuberculosis Incidence Rate
County: Shelby Tuberculosis Incidence Rate
4.6
Cases per 100,000 population
(2018)
Compared to:
TN Value
(1.9)
The regional value is compared to the Tennessee State value.
US Value
(2.8)
The regional value is compared to the national value. The source for the national value is Centers for Disease Control and Prevention
Prior Value
(4.6)
Prior Value compares a measured value with the previously measured value. Confidence intervals were not taken into account in determining the direction of the comparison.
Trend
This comparison measures the indicator’s values over multiple time periods.<br>The Mann-Kendall Test for Statistical Significance is used to evaluate the trend<br>over 4 to 10 periods of measure, subject to data availability and comparability.
HP 2030 Target
(1.4)
